A common problem faced by many people is to manage meetings across multiple time zones. Knowing the exact time to set meetings can be cumbersome if you have to calculate local time for each participants in your meetings. India’s time zone is GMT + 5.30, a 30 minutes offset makes mental calculations difficult during the conversions. And then sometimes you are away in another time zone and you have meetings with folks back home.
I use Microsoft Outlook to manage all my meetings and it provides a simple option that helps visualize your calendar in a way that makes looking at multiple time zones and meetings very easy.
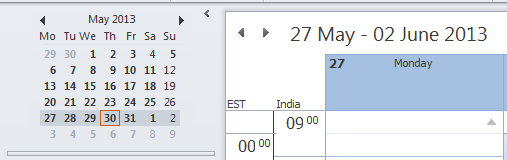
You can show two time zones in Outlook, I have set India and EST (Eastern Time) zones. There is no need for mental calculation or otherwise in these two time zones. I can see both times side-by-side.
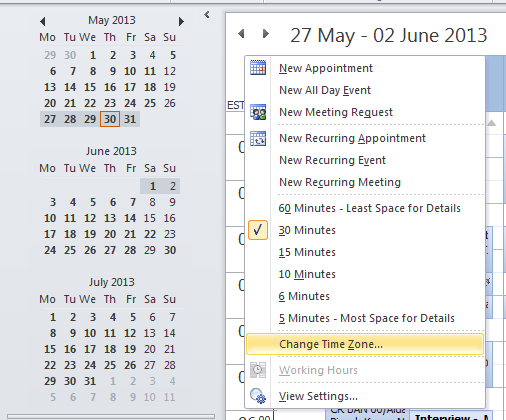
To enable this view, go to Calendar view and right click to “Change Time Zone…” and “Show a second time zone”.
In my opinion this is a problem well solved with good Data Visualization.
What other common problems have you seen solved by good data visualization?