Data disruption in trucking

Posted in Analytics, Data visualization, Decision Making, Disruption Opportunities, Internet of Things (IoT)

Global trucking revenue pool is close to USD 2 trillion dollars which is about 20X the cab market revenue pool. Even in the developed market such as US, it is a highly fragmented and antiquated business which lacks use of technology and data.

If you are an aspiring leader in technology and data, this is the place to be for the next 5-10 years for the following 3 reasons:

  1. It is a large and highest growth market to create impact, second only to goods commerce. More the internet commerce happens, higher the need of logistics and trucking to move goods. The next Amazon and Alibaba will come from Supply Chain technology and data disruption.
  2. The technology and data play is only starting to begin. Data availability is exponentially increasing through GPS, smartphones and IOT sensors.
  3. The problems are far more challenging and futuristic. It requires interplay of automation using IOT/driver assist systems, advanced mathematics/algorithms, and high quality UI/UX to exponentially increase adoption. Many other sectors don’t offer such a wide range and depth of problems.

Rivigo is leading the wave of disruption in trucking through a combination of the following factors

  • Unique operational ideas based on driver and network relay. First globally.
  • An outstanding leadership team across business, operations and technology
  • A strong and unflinching belief in the power of data

Rivigo has already attained a high quality business scale in India and aspires to build solutions which are applicable globally. In the truest sense, it has the potential to do what Amazon and Alibaba have done to commerce, Uber has done to cabs and several other disruptors have done to large global markets. The next 5-10 years is going to be exciting and enriching – some of the sample problems Rivigo tech and data teams work on:

Network relay model

The driver relay model needs sophisticated technology to ensure that millions of trucks can run smoothly every month with several millions pilot changeovers. The underpinning of this technology is a network model that can predict estimated time of arrival, simulation models to predict vehicle arrivals, wait time optimization and driver performance and behavior. This model brings everything together from the network and creates a coherent stream of output to make the pit stop changeover process seamless and scalable

Fuel analytics and optimization

Fuel is one of the biggest operating cost in logistics and fuel pilferage is a rampant problem for any trucking company having fleet of vehicles. However, reliable technology solutions are not available at present to prevent pilferages as the values fluctuate and the data has to be processed real time for even small reduction in fuel value. A fuel graph is a volatile time series graph, very similar to some of financial time series models and requires both predictive and heuristic problem solving approach. We are building patented fuel technology involving many complex algorithms and data science models to improve fuel efficiency.

Resource allocation and optimization

In trucking any idle capacity – truck or the driver is a fungible capacity. You cannot keep less or more of capacity at any point in the network. This is a massive problem and requires queuing theory, linear programming and advanced mathematical modeling to ensure the system is optimized and balanced

Human behavior analysis

Good driving is at the core of making logistics successful. This means that every minute of driving across the network has to be monitored and analysed. The big data from past and current has to be constantly evaluated to determine and predict the driver’s behaviour. This needs to be done in real time to know how a driver is driving to make immediate corrective actions. Is the driver in control of the vehicle? Is the driver driving carefully? Is the driver driving cautiously? These are just some of questions that needs to answered to convert a qualitative system via quantitative model.

location-intelligence

Geo analytics

All the trucks at Rivigo are fitted with several different sensors and IoTs. These IoTs generate massive amount of data that needs to be processed, consumed and analysed. The analysis and data science on this data turns Rivigo trucks into smart trucks. The smart trucks run on a geo-grid and we are building very advanced location analytics engine for constant monitoring and simulating intelligent events. We are building an artificial intelligence layer based on machine learning and deep learning approach for simulation such as demand-supply matching, traffic maps (imagine Google Maps for logistics), hotspot and density analysis.

Time continuum and visualization

Rivigo is building a time continuum of its key resources that will allow to predict and create performant and efficient logistic system. A time continuum is analysis and visualization of all that is happening during the lifecycle of the resource and is a solution that gets built after applying algorithms, intelligence and predictive behaviour on a time-series on huge quantities of data. This needs scalable real time and batch processing over big data.

Line haul planning

Line haul planning optimizes the plan based on historical demand, volumes and service time commitments. The planning model determines the number of vehicles required on each route and network in an optimized way such that the shipments can be routes in the most efficient way. This planning can also be used for processing center capacity planning and building sales strategy to optimize the entire network. This problem is inherently an LP problem with multiple optimization and requires very sophisticated approximation and heuristics to solve it.

Tech platform

One of our over-arching goals is bring 2 million trucks in India online in the next 3-4 years. We are building a high quality tech and data platform to bring the entire trucking commerce (fuel, service, brokerage, resale, financing) online to ensure higher efficiency, lower costs and data led optimization for individual truckers. This is an immensely exciting project being led by world class engineers.

The future will be better if we waste less and use less and less resources for more and more output. Rivigo’s core operating philosophy is based on this approach – through use of data we want to further gain the marginal efficiency to make the world of logistics as automated, efficient and safer as possible.

Please do reach out at hemant@rivigo.com if you have common interests.

Action based framework for Better, Faster & Cheaper features

Posted in Decision Making, Ideas, Technology

While working on a recent project, I prepared a list of following questions that helped me identify tasks that can lead to features with better, cheaper and faster characteristics.

– Repeatable tasks that can be minimized
– Mundane tasks that can be automated
– Challenging tasks that can be simplified
– Unnecessary tasks that can be removed or hidden

Once these tasks are identified, the next steps was to decide on what actions can be taken to minimize or simplify them. The table below summarizes a simple framework where tasks can be listed with appropriate action to solve them.

Better_cheaper_faster Model

The framework allows you to create new categories of task by adding a new row, or defining new actions by adding extra value in the Action column. Finally, you can define the characteristic of each solution (Better/ Cheaper/ Faster) that you have identified for a given problem. Since this framework focuses on finding problem tasks, there is greater flexibility in defining, modifying and reaching a cheaper, better or faster solution.

For example, a common task that many of us do is to interact with phone while walking. Now if this is a problem that you want to solve, you can define a new category called “Hazardous task” by adding a row for it. An action that can “Minimize” the hazardous nature will be to build a proximity sensor in the phone. And you can classify this solution to be “better” than what is already available on phones or what user do today to avoid bumping into someone!

The Math behind A/B testing to ascertain which site is better

Posted in Analytics, Decision Making, Marketing & SoMe, Technology

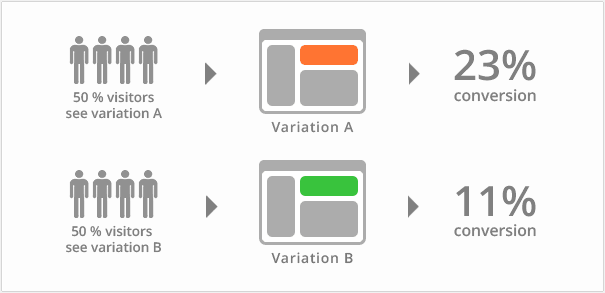
Assume you have two website designs – A & B on your eCommerce website, and you end up with 45 conversions out of 100 visitors for design A and 50 conversions out of 100 visitors for design B.

A_B_testing

What’s the chance that design B is better than design A?

10%? No, that’s wrong. Design B is actually 76% better than design A and to make the switch, this probability has to be > 90%. Part-2 above also provides a shortcut formula to make this calculation.

The below three part series provide very good English and Math explanation on how to evaluate results from split testing on two designs.

Part – 1, Part – 2, Part – 3


Even a simple transaction is no longer simple – Recharge coupons story

Posted in Decision Making, Disruption Opportunities

Life was simple when cable television and mobile started prepaid model. All you have to do is to decide the right recharge amount to continue to use the service, go online and recharge. The only additional complexity was selecting the call rate for different recharge option in case of prepaid mobile.

It ain’t simple any longer. I was recently trying to recharge my cable television account and I was shown a variety of coupons that I can get *free*. And then you have services like paytm and freecharge that formalizes this business model.

recharge

While the idea of using coupons to market and get customer is great, there are few problems with this approach.

1. A simple recharge option has to go through a complex decision making process. The reason I am online is not to shop but to recharge the account.  The decision making and hence the transaction is slowed down because there are just too many coupons to chose from.

2. Feeling of losing out on something. There will be a tendency to perhaps check all the coupons to avoid the fear of losing out on something free. After navigating to the third page, it is easy to forget that you logged in to recharge your prepaid account and not shopping.

3. Most options are not useful. At least that’s how they appeal to me. Maybe I was not looking to shop but to recharge or maybe I do not have need to use any of the options in near future.

What can be done

The current model needs to be flipped. When I am shopping, show me the option to recharge and not the other way round. The money for this recharge can still come from the mobile or cable provider. The benefit with this approach is that it will give me a sense of instant discount or benefit on the purchases that I am making. The coupons are suddenly useful. While I may accumulate more in my prepaid account but there is almost a certainty of using the extra recharge sooner or later.

3 Ways Engineers can think like Product Managers

Posted in Decision Making, Ideas

In product companies, the business teams highly solicit good ideas coming from the engineers. While engineers often come up with many bright ideas, they lack a proper structure that can guide them through the idea development phase and prioritize top ideas. Once you have an idea, use the following three classifications to evaluate your idea, rate it or present to others.

1. Customer Value

A simple way to check customer value of your idea is to measure in terms of better, cheaper or faster? Is the new feature or idea better than whatever else that already exist, perhaps in a competing product?

If you use a 1-5 scale where 5 denotes highest customer value, call the highest value of 5 as customer delight. So, instead of a numeric scale, really think of a scale where high value indicates customer delight and low value indicates hygiene.

CustomerValueMeasurementScale

So, the question to answer is – “Will the idea provide delight to the customer or be seen as hygiene?”

2. Business Impact

How will this idea impact the business of your product? Measuring business impact is already a very challenging task for product managers and can be daunting for engineers. A simple way is to think if your idea will feature prominently in the decision making of your customers. For example, a feature that improves performance of the system can have high business impact.

Typically you would expect high customer value to be associated with high business impact. This is not true in cases where the user of the product is different from the decision maker. For example, you may have an enhancement request related to changing the user interface workflow with maximum user votes. This request has high customer value but not high business impact. Simplifying licensing can have high business impact but low customer value.

3. Engineering Effort

This effort analysis should not be difficult for engineers. You have to decide if building this idea is a low effort or high effort initiative. If it is high effort, can it be done in phases? Low hanging fruits with medium customer value or medium business impact often find their way into the next product releases.

Overall Priority Calculation

Many a times these ideas are targeted towards existing Go To Market (GTM) – and hence some of the aspects around target customer, size, opportunity, channels and how to reach target segment need not bother engineers. If you have multiple ideas, or  if you are managing multiple ideas as a lead, mentor or manager, you can tabulate and sort your top ideas as shown below.

Idea_valuation_table

And you now have enough scope to apply mathematics as you feel like to decide priority.

How your hiring abilities impact voting decisions

Posted in Decision Making, Hiring

It is that time of 5-year period when you have to make a political choice. The good news is that more people are making this choice. The polling figures so far shows around 20-40% increase in the polling. There is a sense of urgency in the people. However, many people are still struggling to decide who they can vote as the best candidate.

I want to compare how this decision making process is similar to the decision making during hiring process. Hiring process typically involves a panel of 4-5 people with a hiring manager. Many of us have been part of such panels. The outcome of hiring process is a boolean – Yes or No. You either select or reject a candidate.

If you have been on interview panels for long enough, you may not be surprised to know that there is at least one person who actually ends up with a “maybe” vote. And many companies support this “maybe” decision by having a 3-pointer scale or much worse, a 5-pointer scale. The worst is when the entire panel declares a “maybe” decision resulting in “on-hold” candidates.

Interview

Now if you are an interviewer who replies with a clear Yes or No, you should not have much trouble in deciding your candidate for this election. It is possible that you have done a detailed research, asked references, attended a campaign or just used your gut.

If you are an interviewer who often replies with a “maybe”, you are in trouble. What do you do when you are the hiring manager and you are forced to select or reject a candidate? Do you try to find more information about the candidate? Do you discuss with other interviewers? Do you search their web presence? Do you do background verification? Do you talk to references to know about their past work? You will probably do anything that will help you to make a firm decision.

There are many things that you can do if you want to make a good choice. The below quote by Jim Collins is applicable to both hiring and voting.

“Get the right people on the bus and the wrong people off the bus”

Note to my international friends and followers – India follows multi-party democracy with 6 national parties, 47 state parties and 1563 other parties.