Data disruption in trucking

Posted in Analytics, Data visualization, Decision Making, Disruption Opportunities, Internet of Things (IoT)

Global trucking revenue pool is close to USD 2 trillion dollars which is about 20X the cab market revenue pool. Even in the developed market such as US, it is a highly fragmented and antiquated business which lacks use of technology and data.

If you are an aspiring leader in technology and data, this is the place to be for the next 5-10 years for the following 3 reasons:

  1. It is a large and highest growth market to create impact, second only to goods commerce. More the internet commerce happens, higher the need of logistics and trucking to move goods. The next Amazon and Alibaba will come from Supply Chain technology and data disruption.
  2. The technology and data play is only starting to begin. Data availability is exponentially increasing through GPS, smartphones and IOT sensors.
  3. The problems are far more challenging and futuristic. It requires interplay of automation using IOT/driver assist systems, advanced mathematics/algorithms, and high quality UI/UX to exponentially increase adoption. Many other sectors don’t offer such a wide range and depth of problems.

Rivigo is leading the wave of disruption in trucking through a combination of the following factors

  • Unique operational ideas based on driver and network relay. First globally.
  • An outstanding leadership team across business, operations and technology
  • A strong and unflinching belief in the power of data

Rivigo has already attained a high quality business scale in India and aspires to build solutions which are applicable globally. In the truest sense, it has the potential to do what Amazon and Alibaba have done to commerce, Uber has done to cabs and several other disruptors have done to large global markets. The next 5-10 years is going to be exciting and enriching – some of the sample problems Rivigo tech and data teams work on:

Network relay model

The driver relay model needs sophisticated technology to ensure that millions of trucks can run smoothly every month with several millions pilot changeovers. The underpinning of this technology is a network model that can predict estimated time of arrival, simulation models to predict vehicle arrivals, wait time optimization and driver performance and behavior. This model brings everything together from the network and creates a coherent stream of output to make the pit stop changeover process seamless and scalable

Fuel analytics and optimization

Fuel is one of the biggest operating cost in logistics and fuel pilferage is a rampant problem for any trucking company having fleet of vehicles. However, reliable technology solutions are not available at present to prevent pilferages as the values fluctuate and the data has to be processed real time for even small reduction in fuel value. A fuel graph is a volatile time series graph, very similar to some of financial time series models and requires both predictive and heuristic problem solving approach. We are building patented fuel technology involving many complex algorithms and data science models to improve fuel efficiency.

Resource allocation and optimization

In trucking any idle capacity – truck or the driver is a fungible capacity. You cannot keep less or more of capacity at any point in the network. This is a massive problem and requires queuing theory, linear programming and advanced mathematical modeling to ensure the system is optimized and balanced

Human behavior analysis

Good driving is at the core of making logistics successful. This means that every minute of driving across the network has to be monitored and analysed. The big data from past and current has to be constantly evaluated to determine and predict the driver’s behaviour. This needs to be done in real time to know how a driver is driving to make immediate corrective actions. Is the driver in control of the vehicle? Is the driver driving carefully? Is the driver driving cautiously? These are just some of questions that needs to answered to convert a qualitative system via quantitative model.

location-intelligence

Geo analytics

All the trucks at Rivigo are fitted with several different sensors and IoTs. These IoTs generate massive amount of data that needs to be processed, consumed and analysed. The analysis and data science on this data turns Rivigo trucks into smart trucks. The smart trucks run on a geo-grid and we are building very advanced location analytics engine for constant monitoring and simulating intelligent events. We are building an artificial intelligence layer based on machine learning and deep learning approach for simulation such as demand-supply matching, traffic maps (imagine Google Maps for logistics), hotspot and density analysis.

Time continuum and visualization

Rivigo is building a time continuum of its key resources that will allow to predict and create performant and efficient logistic system. A time continuum is analysis and visualization of all that is happening during the lifecycle of the resource and is a solution that gets built after applying algorithms, intelligence and predictive behaviour on a time-series on huge quantities of data. This needs scalable real time and batch processing over big data.

Line haul planning

Line haul planning optimizes the plan based on historical demand, volumes and service time commitments. The planning model determines the number of vehicles required on each route and network in an optimized way such that the shipments can be routes in the most efficient way. This planning can also be used for processing center capacity planning and building sales strategy to optimize the entire network. This problem is inherently an LP problem with multiple optimization and requires very sophisticated approximation and heuristics to solve it.

Tech platform

One of our over-arching goals is bring 2 million trucks in India online in the next 3-4 years. We are building a high quality tech and data platform to bring the entire trucking commerce (fuel, service, brokerage, resale, financing) online to ensure higher efficiency, lower costs and data led optimization for individual truckers. This is an immensely exciting project being led by world class engineers.

The future will be better if we waste less and use less and less resources for more and more output. Rivigo’s core operating philosophy is based on this approach – through use of data we want to further gain the marginal efficiency to make the world of logistics as automated, efficient and safer as possible.

Please do reach out at hemant@rivigo.com if you have common interests.

Alibaba Singles’ Day Sales – What it means for technology in logistics

Posted in Analytics, Disruption Opportunities, Internet of Things (IoT)

On November 11, Alibaba posted a record $14.3 billion in sales on Singles’ day passing every record that any company have ever posted. And this is just the beginning of what it means for future of logistics.

According to the Bloomberg post, Alibaba quoted

“Alibaba estimated that 1.7 million deliverymen, 400,000 vehicles and 200 airplanes would be deployed to handle packages holding everything from iPhones to underwear. Mobile devices accounted for 69 percent of Wednesday’s transactions.”

This is significant in many ways. The technology needed for building such kind of reliable logistics has to provide intelligence at another level. Imagine a constant stream of geo-location data from half a million trucks.

How will you place such large number of trucks every day? What will be the placement algorithm that will be used?

How will the technology churn data at this large scale on a low latency system? How will you design technology for such low latency?

logistic technology

What about the memory and server farms that will be setup? What about the failure points in the system? The system cannot go down under any circumstances because there is no way to find something missing manually – a needle in haystack!

How will you monitor performance? Nobody can watch the normal performance of 400,000 trucks. Just imagine if looking at a truck takes 1 minute, you need 400,000 minutes or around 6,666 hours or cool 277 days to monitor these trucks. What kind of user interactivity that needs to be provided with the use of technology that will make 277 days job to a less than few minutes job.

There is a disruption in the logistic industry that requires another level of technology and it is inevitable!

Image courtesy – altronshpg

Introducing Rivigo Labs

Posted in Analytics, Data visualization, Disruption Opportunities, Internet of Things (IoT)

At Rivigo, data meets logistics and magic follows. We are transforming the antiquated logistic industry and bringing it into the 21st century with process automation, driver analytics and data science.

Rivigo is re-envisioning the truck as a Internet of Things (IoT) platform with intelligent sensors that constantly interact with a real-time responsive logistics network. We use the IoT to assist in integration of communications, control, and information processing across logistics networks that focus on all elements including the vehicle, the infrastructure, and the driver.

riv-logo

The charter of Rivigo Labs is to create the next generation of data acquisition, processing and visualization tools that will drive change in the logistics industry. Some of the problems we work on includes network optimization, recommendations systems, end-to-end automation, human factor design, smart trucking systems and beautiful visualizations, all at tremendous scale. We are not only pushing the envelop in the logistics industry, but we are also generating cutting edge tools in IoT, data science and people analytics.

In nutshell, we are building next generation transportation data science!

The Math behind A/B testing to ascertain which site is better

Posted in Analytics, Decision Making, Marketing & SoMe, Technology

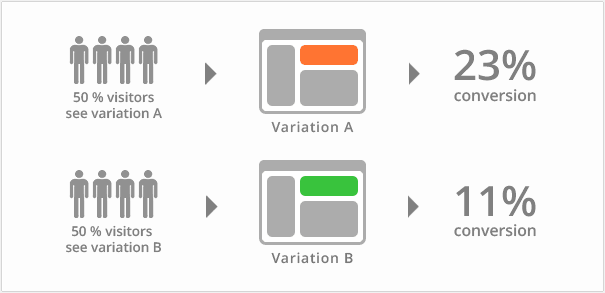
Assume you have two website designs – A & B on your eCommerce website, and you end up with 45 conversions out of 100 visitors for design A and 50 conversions out of 100 visitors for design B.

A_B_testing

What’s the chance that design B is better than design A?

10%? No, that’s wrong. Design B is actually 76% better than design A and to make the switch, this probability has to be > 90%. Part-2 above also provides a shortcut formula to make this calculation.

The below three part series provide very good English and Math explanation on how to evaluate results from split testing on two designs.

Part – 1, Part – 2, Part – 3


How Happy Birthday is said on greeting channels today

Posted in Analytics, Data visualization, Marketing & SoMe

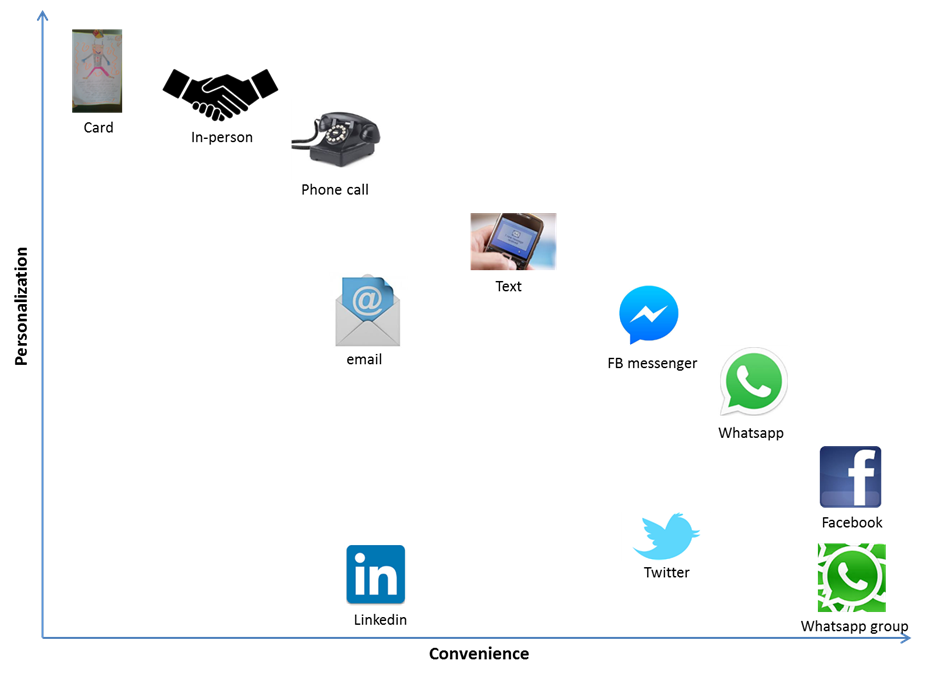
I was researching digital marketing and social media concepts on my birthday. And I could not stop myself doing some analysis on all the greetings that I received. I plotted 200+ greetings that I got via various channels on “Personalization” and “Convenience” axis.

HappyBirthdayWishes

“Personalization” reflects how much personalization is possible via a given channel. It is not about you but about the ability and common usage of a given channel.

“Convenience” reflects convenience of people to use a given channel to send greetings. I received a large number of greetings on Facebook and hence the convenience factor is high for this channel. It is clear that new social media channels provides high degree of convenience and allow us to use special occasions to be in frequent touch.

I should clarify – it is the channel that does not allow personalization. And not the people. Over a phone, you will talk more. Over a facebook greeting, you will be short. This is how I do. I write short messages on Facebook or whatsapp for greetings and find it very convenient to wish my friends.

To all my friends,  once again thank you for your wonderful wishes.

What do you want to be in your career?

Posted in Analytics, People & Culture

Career development is a challenging problem to solve for most individual themselves as well as managers on behalf of their team. Many individuals find it difficult to clearly define their career aspirations and what opportunities or possibilities are available to them. One of my friends after attending a staff meeting of several managers said – “It is tough for all managers to get career development goal from their team members and I was thinking it was just me.”

This issue compounds for managers as they have to think on their team’s behalf – what is best for them and what aspiration do they have. The message is simple – you have to think about your own career development choices. But how? I created a short survey to find out more about people’s career aspiration and what the trend is.

I need your help in filling a 7-question survey on career aspiration. Here is the link https://www.surveymonkey.com/s/GG36D2J

career

If it takes more than 5 minutes, I owe you a beer. Make sure to leave a comment 🙂

Update: Thanks to everyone for filling the survey. The current average time for filling the survey is around 3 minutes. No pressure 🙂

How LinkedIn is reinventing itself

Posted in Analytics, Hot, Ideas, Marketing & SoMe

Linkedin used to be a quiet place where professionals would go to update their profile, make new connections or know about what their friends and peers do from a professional point of view.

What’s new

This is all changing. These days I do notice lot more activities from Linkedin. LinkedIn is sending three types of mails to me on a regular basis.

1. Linkedin message on who viewed your profile.

2. LinkedIn pulse on new articles recommendation on Linkedin.com

3. Linkedin updates on job changes and work anniversaries of your connections. This allows you to stay up-to-date on your connections and “say congrats” much like “say happy birthday” feature of Facebook.

These changes are very interesting and my visits to Linkedin have somewhat increased. I never considered it to be a place to post my new blog articles but Linkedin is now 3rd topmost traffic driver to my website. Instead of a burst in traffic, it provides a steady traffic flow to my blog.

LinkedIn-Logo

What is driving these changes?

So, the real question is what is driving these changes at Linkedin? Let us try to look at some important statistics.

– Linkedin has around 60 million users
– 85% use the free account
– 50% spend 0-2 hours/week

It is clear that Linkedin needs to make people spend more time with them if they want to be able to monetize a huge 85% of their user base. The question then is what should they do? Let us look at some more statistics.

– The 3 most helpful Linkedin features, based on recent statistics are – “who’s viewed your profile (70%)”, “people you may know (65%)” and groups (60%)
– Consider trends in social media. According to Pew Research, 78% of Facebook users mostly see news when on Facebook when they have logged into Facebook for other reasons. They are consuming news against their original intention. This is significant. It reflects human ability to pay more attention to news when it is coming from a known/trusted source.

Connecting data to Linkedin strategy

With this information, it is easy to see that Linkedin needs to do something that will help drive traffic to Linkedin.com. Providing regular mail updates on who’s viewed your profile makes sense. This is what their users have found most useful.

Using the latest trend in the way people consume news on social channels is an excellent way of reinventing itself. LinkedIn is focusing a lot on providing stories and news articles. This will allow them to move to monetization via sponsored stories.

The third piece of the puzzle is to engage users by making them do something when they visit Linkedin.com. This leads to higher page time and can be translated into various monetization and growth strategies. Endorsing your connection and “say congrats” is a good start.

However, this is also an area where much is left to be done. And I think Linkedin needs some sort of user experience refresh to allow them to take this engagement to a higher level.

Real state performance for housing market

Posted in Analytics, Data visualization, Ideas

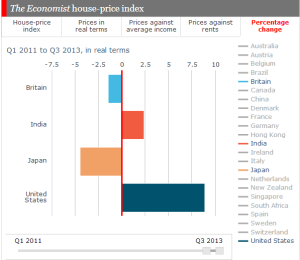
The Economist published a study on appreciation of house-price in last few years. The data for most developed countries is available from 1975 but for India it is available from 2011 year onward.

So, if you are invested in property market in India recently or are interested in knowing how you property has appreciated in recent times, I have prepared a quick summary –

1. The nominal increase in house price in India is 25% since 2011.

2. Not surprisingly, inflation has eater away much of the gains resulting in just 2.4% price appreciation in real terms.

3. Year 2013 is significantly bad in India with 7% yearly decrease in first three quarters. However, housing price in US has actually grown by 7% during the same time.

house price

This measurement is in real terms meaning it takes into account the effects of inflation on purchasing power.The city wise data drill down is available for USA but not other countries. I guess, India is not really as thorough in collecting house-price data as other important indicators like price against rents (to gauge return on real state investment) and price against average income (to measure affordability) are missing.

Here is the direct link to the charts.


FDA wants to ban genetic tests by Google-backed 23andme

Posted in Analytics, General

23andme is one of the companies I am always fascinated about from a BigData perspective as they have access to huge amount of data that can dramatically change the healthcare systems in the world and and I have discussed this in many conversations with my friends and colleagues.

About 23andme

23andme is a DNA analysis company and is backed by Google. How does it work? Well you order a kit and provide saliva sample and send your kit back to 23andme. The company runs a DNA analysis and then provides details about your health risk, carrier status and drug response based on a detailed genetic analysis. Why do you need it? Knowing your health risks will allow you to manage your health better and can make some lifestyle changes and take some preventive action. Additionally, you can find out fun stuff, like if you have ancestors in another country. For example, DNA tests reveal that Prince William has ancestor in India.

23andMeBan1

Why is FDA worried?

It all sounds great but then why is Food Drug & Administration (FDA) worried? FDA is worried about potential pitfalls of false positive and false negative about health risk assessment and drug response. For instance, a false positive on risk assessment on breast or ovarian cancer could lead a patient to undergo prophylactic surgery or chemotherapy. While a false negative could lead someone to overlook an actual risk that may exist. FDA is also worried if drug response test will lead patients to self-manage their treatments by dose changes or stopping certain drugs.

The real issue is not that the tests are bad – these tests bypasses a physician’s presence and his assessment of patients health and response and expose consumers to the risk of trying to self-manage their own treatment of serious diseases or if incorrect test results are reported.

What 23andme should do is to prove to FDA that the tests work and are accurate. Easy problem you data scientist, huh? It should also educate the consumers about the risk that are inherent in such tests and provide guidance to consumers on how to use the results.